
Phoenix Housing Market Update - February 2016
Long Term Trends
Inventory spiked in January which is a typical pattern we see each year. Total active listings are 20,728, that's an 8% decrease in inventory from a year ago. And we are slighlty above our 5 year average of 20,673 homes for sale in January.
Sales and demand are increasing and will continue that pattern over the next 4 months as we have entered our peak selling season. Total sales for January was 5,094 which is almost a 9% increase from a year ago. That sales volume is below our 5 year average of 5,313 sales for the month of January.
Median sales price for January was $210,00 which is $5000 less than December, but still approx 7.7% better than a year ago. This well above the 5 year average of $172,490 and shows us the radical improvement the market has made over the past 5 years.
Average days on market went up a bit from 76 in December to 79 in January. This is an improvement from a year ago when it was 95. The 5 year average is 83. These trend lines are normal and consistent with trends we see each year.
The average sold to list price for October was 95.6%, which is largely unchanged from the previous month. The 5 year average is 95.0%, so again you can see we are seeing normal trend lines.
Short Term Trends
In January New Listings were up from December by 77.5% and Pending Sales increased by 42.2%. Closed Sales in January decreased 22.9% from December. This is telling me that inventory and demand is increasing and Decemeber was actually a pretty strong month. Median price decreased, but I'm expecting that to rebound in the coming months. These short term trends typical, but it feels like sellers are losing leverage. I suspect it to tip back into the sellers favor over the next 4-5 months.
The market appears to be moving from a strong Sellers market to a more balanced market. It still favors Sellers, however increasing inventory and weaker demand are starting to work against Sellers.
Interest Rate Watch
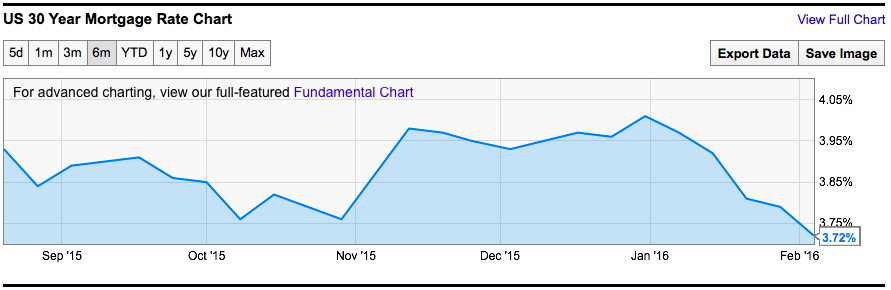
Average US rate on 30-year mortgage falls for 5th straight week
WASHINGTON (AP) — Average long-term U.S. mortgage rates fell for the fifth straight week amid volatility in world financial markets.
Mortgage buyer Freddie Mac says the average rate on a 30-year fixed-rate mortgage slid to 3.72% this week, down from 3.79% last week and the lowest since it averaged 3.68% in April 2015.
The average rate on a 15-year fixed-rate mortgage slid to 3.01% from 3.07% last week.
Mortgage rates have continued to fall despite the Federal Reserve’s decision in December to raise the short-term rate it controls for the first time since 2006.
Global markets have been rattled this year by signs of a global slowdown and big drops in the price of commodities, including oil. Investors have sought refuge in U.S. Treasury’s, pushing down long-term U.S. rates.
To calculate average mortgage rates, Freddie Mac surveys lenders across the country at the beginning of each week. The average doesn’t include extra fees, known as points, which most borrowers must pay to get the lowest rates. One point equals 1 percent of the loan amount.
The average fee for a 30-year mortgage was unchanged at 0.6 point. The fee for a 15-year loan was also unchanged at 0.5 point.
The average rate on five-year adjustable-rate mortgages fell to 2.85% this week from 2.90% last week; the fee slid to 0.4 point from 0.5 point last week.
Clipped from USA Today on February 4, 2016, via Associated Press
Is Zillow a Good Website to Use for My Home Search?