Real Estate Information

Phoenix, Arizona Real Estate

James & Amy Lombardi

Blog

Displaying blog entries 41-50 of 51

Wake Up Wednesday - The Miracle Morning - Week 2

by James & Amy Lombardi


There are 6 steps to the Miracle Morning:

Silence

Affirmation

Visualization

Exercise

Reading

Scribing

These six areas are critical to focus on each morning to change your life to reach the level 10 life you deserve. These areas focus on developing yourself into the person you want to be. They need to be a daily discipline to become the person you want to be.

Silence (meditation) can be a game changer. This time is purposeful and focused. Try it out for a couple of months to see the difference quieting your mind can create. Start out with 5 minutes, focusing on your breath, count to 4 as you inhale and exhale. Then after a month or two do it for 10 minutes. Having quiet time can help relieve stress and anxiety to push towards your level 10 life. This time also helps you learn more about yourself and slowdown in the fast-pace, busy life. Affirmation and visualizations can easily be added into your time of meditation. There is no right way to sit in silence.

Affirmation is repetition of positive thoughts. It builds more confidence and keeps you focused on what you want in your life. Your thoughts become your reality. Repeating your affirmation programs your subconscious mind to overcome fears and bad habits. To create your affirmation here are five simple steps: 1) Determine what you want or what you need to improve in your life. 2) Why do you want it? This should align with your purpose. 3) Get clear on who you need to be. 4) What are you committed to doing to obtain it? Be specific. 5) Add inspirational quotes.

Visualization is the mental process of imagining exactly what you want to achieve or attain. When you mentally rehearse the execution of the process you are more likely to achieve your goal. Visualize all the positive steps it takes to achieve those goals. Sit up tall and clear your mind and picture who you need to be and the positive steps you will take to get there. Another get task you can do is to create a vision board. Find pictures of what you want and your dreams and post them on a board that you will see everyday. This will be a physical reminded of your vision and goals!

Exercise is another critical step that your body truly needs. It boost your energy and metabolism. When you start to get your blood flowing early you will think more clearly the rest of the day. This, like the other steps, becomes a discipline that needs to be formed and will become easier to do overtime. Isn’t it amazing how much better you feel if you just do it. Plan out your time and start with a small, realistic daily goal.

Reading was added as another step in the Miracle Morning routine. Reading is one of the best way to learn and develop yourself. To reach your level 10 vision you should be reading something that will teach you a new positive skill or read about the people who have achieved the things you want. Learning from others mistakes is the best way to avoid pain and regret. Reading only positive self-development books, fictional books are entertaining but not beneficial to reach your goals and shape you to who you want to be.

Scribing is the final step of the Miracle Morning. Each day write down three things you are thankful for in your gratitude journal. This places the focus on all the positive things we are blessed with in our life. It keeps us from falling into the trap of focusing on what we don't have.

The morning sets the mood of the rest of your day and creates the passion to achieve your dreams. Our team is working through these steps and recognizing where we are and how far away we are from our level 10 life. Step 2 of the challenge is the “Wheel of Life” Assessment. This visually demonstrates the current level of success and satisfaction in 10 different areas: Physical Environment - Family & Friends - Personal Growth & Development - Spirituality - Finances - Career & Business - Significant Other & Romance - Fun & Recreation - Contribution & Giving - Health & Fitness. With these 10 areas we then decided on a scale of 1 to 10 where do we feel right now. We found that there is always room for improvement, yet also recognized that we should not beat ourselves up if we are not where we want to be. Going through each area individually was good for us to reflect on and focus on individual goals for those areas to increase our potential. Where are you at on the scale?

Wake Up Wednesday - The Miracle Morning - Week 1

by James & Amy Lombardi


As our team has grown this year we have committed to challenging and holding one another accountable to being successful and moving in the right direction daily. One way we are focusing on this goal together is by working through the same book, sharing our thoughts and takeaways. As we are reading on leadership principles and self-development skills we have decided to share our feedback and notes from each discussion with you.

The first book we just started reading as a team is The Miracle Morning by Hal Elrod. We are also working through the 30-Day Life Transformation Challenge Fast-Start Kit he offers. This is exciting for us to share! We truly believe there is going to be great benefit from taking time each day and learning from one another. We are trying to wake up to reach our full potential. H

“95% of people struggle their entire lives”

Right from the beginning, this book dives into rising above mediocrity. The first is to acknowledge the 95% reality check. Our society settles for less than what we want and justifies that it is okay. After you realize and can recognize this reality you must identify the causes of mediocrity. There are seven common causes that we should try to avoid to reach our full potential. We dug into each cause to identify how this plays out in our lives.

Mediocrity is a choice that leads to regret.

The Rearview Mirror Syndrome

Limitations of past experiences carry stress and worry from yesterday into today. You have to believe that the past does not define you and does not equal the future. You can start every morning new to shape your desired future.

Lack of Purpose

To find your purpose you have to learn what inspires you. Most people pursue a life of pleasure rather than purpose. Material possessions in America have increased, where statistically the happiness level has decreased over time. Finding your purpose over pleasure that only lasts a short period of time is the switch needed. This means being the person you need to be to create the life you want. We are asking the question: How can we add value to someone life?

Isolating Incidents

It is a hard task to stay disciplined and focused. We have instilled into our values “Doing what’s right, not what’s easy.” Daily discipline creates a lifestyle. Everything we do affects who we are becoming.

Lack of Accountability

Accountability, while at the same time says “I love you” also can be hurtful and tough to handle. Having accountability brings much-needed order to your life. There is not only a need for accountability partners but there should be an accountability system in place to continually point you in the right direction. It might not always be easy, but it is needed.

Mediocre Circle of Influence

You are the direct result of the 5 closest people in your life. To shape your future to be successful, your circle of influence should be with those who are positive and have ambition, so you too become positive and ambitious. It would be wise to surround yourself with people that believe in you but also challenge you. The old saying is true, ‘Show me your friends and I will show you your future.’ You have the power to create a strong future for yourself, but everyone needs someone to support them.

Lack of Personal Development

Leaders never stop learning. Setting aside time each day to improve yourself can change the trajectory of your future. “Your level of success will rarely exceed your level of personal development because success is something you attract by the person you become.” Are you spending time on creating the life you deserve?

Lack of Urgency

The most significant cause of mediocrity leads to procrastination and regret. What you are doing today determines who you are becoming. Many wish to change but few actually work for it. What would it take for you to get out of bed early to make a dramatically make a difference in your life? “If you want your life to be different you have to be willing to do something different first.”

The final cause, the lack of urgency, was a big takeaway for our team. This truly gets down to the "why" we do what we do. This was not only helpful for our business perceptive, but this was a great personal challenge as well. The final step to overcoming mediocrity sounds simple but is extremely hard to apply and stay committed to. YOU must draw a line in the sand and decide what you are going to start doing differently. You can no longer accept mediocrity as an option. How will you draw that line in your life?

“Where you are is a result of who you were. But where you go depends entirely on who you choose to be.”

Check out: http://www.miraclemorning.com

The clarity questions help focus in these ideas:

1. Which aspects of your life can you be more grateful for and present to?

2. What do you want to begin improving/transforming during the next 30 days?

3. Which fears are holding you back from achieving your ‘level 10’ life?

4. Which beliefs do you need to adopt to be able to create your ‘level 10’ life?

5. Why is it a “MUST” for you to start transforming your life - right now?

Phoenix Housing Market Update - July 2016

by James & Amy Lombardi

Phoenix Market Report June 2016

Long Term Trends

Inventory is now starting to tighten up even more which is pushing sales and values even higher. June total active listings were down to 18,828 from 19,405 last month. Inventory a year ago was approx 17,855 and our 5 year average is 17,044 homes for sale in June. 

Sales and demand are both increasing, typically we begin to see a slowdown in July, but there are no signs of that right now. Total sales for June was 8,798 which is an 3.2% increase from a year ago. And sales volume is above our 5 year average of 8,298 sales for the month of June.

Median sales price for June was $230,00 which is approx 7.0% better than a year ago. This well above the 5 year average of $192,044 and shows us the radical improvement the market has made over the past 5 years. 

Average days on market decreased a bit to 74. This is an improvement from a year ago when it was 77. The 5 year average is 77. This is showing us how demand remains strong and values are increasing.

The average sold to list price for June was 96.5%, which is higher of 0.2% from the previous month. The 5 year average is 96.9%, so again we are seeing normal trend lines.

Short Term Trends

The housing market in Phoenix is extremely strong in the $300,000 and below price range. $300,000 - $500,000 is fairly neutral and $500,000+ is favoring buyers. Interest rates hit an all time low in July and you can see how it is has pushed demand even higher which is pushing values up. The median price went up 2.2% in one month!! That's rare and not sustainable, but appears likely to continue in the short term.

We rarely see a market that favors both sellers and buyers, but that is what we have right now. It's a great time to sell because demand is so strong and inventory is limited. It's a great time to buy because interest rates are the lowest they have ever been. Remember a 1% increase in interest rate affects your buying power by 10%. In other words if you can qualify for a $250,000 price point at 3.5% interest rate today, if rates were to spike to 4.5% you would now qualify for $225,000 price point. Rates have been floating between 3.5% - 4.5% for several years now, and they did spike a whole 1% in 30 days back in 2013, so if you are planning to purchase it makes sense to take advantage of interest rates now.

Download June 2016 Housing Report

Interest Rate Watch

NATIONAL 30-YEAR FIXED MORTGAGE RATES REMAIN STABLE AT 3.33%

Thursday, July 21, 2016

The current average 30-year fixed mortgage rate remained stable at 3.33% on Thursday, Zillow announced.

The 30-year fixed mortgage rate on July 21, 2016 is up 1 basis point from the previous week's average rate of 3.32%.

Additionally, the current national average 15-year fixed mortgage rate increased 1 basis point from 2.60% to 2.61%. The current national average 5/1 ARM rate is down 2 basis points from 2.73% to 2.71%.

Why We are Different


View MORE videos About Us

Phoenix Housing Market Update - June 2016

by James & Amy Lombardi

Phoenix Market Report June 2016

Long Term Trends

Inventory tightened up in May as total active listings were 19,405, which is approx 1000 - 2000 less homes for sale than we've been seeing each month in 2016. Inventory a year ago was approx 18,680 and our 5 year average is 17,411 homes for sale in May. 

Sales and demand are extremely strong, but we are nearing the end of our peak selling season so look for this trend to subside. Total sales for March was 8,639 which is an 6.2% increase from a year ago. And sales volume is above our 5 year average of 8,333 sales for the month of May.

Median sales price for May was $225,00 which is approx 6.3% better than a year ago. This well above the 5 year average of $189,750 and shows us the radical improvement the market has made over the past 5 years. 

Average days on market decreased a bit to 75. This is an improvement from a year ago when it was 80. The 5 year average is 78. These trend lines are normal and consistent with trends we see each year.

The average sold to list price for May was 96.3%, which is unchanged from the previous month. The 5 year average is 96.4%, so again we are seeing normal trend lines.

Short Term Trends

The housing market in Phoenix is the strongest its been in a decade. So far there hasn't been any signs of it slowing down, but will see how June/July shake out. Another looming factor that is a wildcard is the Presidential Election is the Fall. Our economy and housing market will surely react to this change, but the questions is will it be good or bad or unchanged? Come experts believe this uncertainty is fueling the current strength... Buyers and Sellers are scrambling to transact before this transition takes place.

The market is definitely favoring Sellers right now, especially in the $200,000 and below market. The $200,000 - $500,000 range is a little more neutral and the $500,000+ market is favoring more Buyers.

Download May 2016 Housing Report


Metro Phoenix housing market has best month in a decade

Catherine Reagor, The Republic | azcentral.com May 27, 2016

Foreclosures low, home building high, prices affordable and buyers are moving to the area.

April just might have been the best month for metro Phoenix’s housing market in a decade.

A look at key indicators and some national rankings show why the Valley’s housing market appears to be stronger than it’s been since the boom and crash.

Foreclosures fell to the lowest level since 2006. Homebuilding continued to rebound. Phoenix kept its spot as one of most affordable big metro areas for homebuyers. And a national moving survey shows the Valley is one of the top 10 U.S. areas where people are moving.

Also, many of the buyers needed for the Valley’s housing market to finally fully recover are here.

An April Street Scout survey of Valley homebuyers and sellers found Millennials and boomerang buyers who lost houses to foreclosure during the crash are buying metro Phoenix homes at a pace the market hasn’t seen before.

According to data compiled for this column by Arizona housing expert Mike Orr of The Cromford Report the Valley's housing market is a bit "complicated" now.

Orr's quick take:

  • For homes priced below $200,000, there's an extremely low supply available for sale, fast price appreciation and low sales counts.

  • For homes priced between $200,000 and $500,000, the supply of homes for sale is slightly low, there's strong growth in demand and moderate price appreciation. 

  • For homes priced between $500,000 and $1 million, there's a high supply available for sale, good demand and little to no appreciation.

  • For homes priced higher than $1 million, there's excessive supply, weakening demand and flat to negative appreciation except for in a few isolated fashionable spots.

Tom Ruff of The Information Market said May’s home sales and prices are likely to be higher than April’s when all are tallied.

Summer’s 100-plus-degree days deter some Valley homebuyers. If home sales and prices continue to climb In June and July, it will be a true testament to the market’s strength.

If not, there’s always the Fall.


Why We are Different


View MORE videos About Us

Phoenix Housing Market Update - April 2016

by James & Amy Lombardi

Long Term Trends

Inventory remained largely unchanged in March as total active listings were 21,005, which is nearly the same amount of inventory we had a year ago. And we are slighlty above our 5 year average of 18,982 homes for sale in March. 

Sales and demand are extremely strong as we are in our peak selling season. Total sales for March was 8,395 which is an 8.4% increase from a year ago. And sales volume is above our 5 year average of 7,912 sales for the month of March.

Median sales price for March was $215,00 which is approx 7.5% better than a year ago. This well above the 5 year average of $180,040 and shows us the radical improvement the market has made over the past 5 years. 

Average days on market was unchanged at 79. This is, however, a significant improvement from a year ago when it was 92. The 5 year average is 83. These trend lines are normal and consistent with trends we see each year.

The average sold to list price for March was 96%, which is largely unchanged from the previous month. The 5 year average is 95.6%, so again we are seeing normal trend lines.

Short Term Trends

The most radical short term trend I can see is that Closed Sales went up 47.4% from the previous month! 8.395 Closed Sales is the 2nd highest amount of sales we've had in a month in the past 2 years. What's also important to note is New Contracts (pending sales) went up 12.8% from February to March which means April will be another very strong month for Closed Sales. This tells us that demand is extremely strong right now and getting stronger! So if you are planning to sell your house you should get it on the market NOW before demand fades toward the end of the summer which is the typical pattern. Currently we have approx a 2.5 month supply of inventory on the market. March and April are typically the strongest months for sales volume every year and it appears to be that way again this year.

The market is favoring Sellers right now, however that may change once we get into July and August. The chart below shows the extreme jump in Closed Sales last month and New Contracts (pending sales) which tells us April closing will be very strong as well.

Download March 2016 Housing Report

Interest Rate Watch

ARIZONA 30-YEAR FIXED MORTGAGE RATES GO DOWN TO 3.47%

Thursday, April 28, 2016

The current average 30-year fixed mortgage rate in Arizona decreased 3 basis points from 3.50% to 3.47%. State mortgage rates today ranged from the lowest rate of 3.40% (HI, SD, WY) to the highest rate of 3.54% (WV). Arizona mortgage rates today are equal to the national average rate of 3.47%.

The Arizona mortgage interest rate on April 28, 2016 is down 1 basis point from last week's average Arizona rate of 3.48%.

Prepping Your Home For Sale - First Impression

View MORE videos on Prepping Your Home For Sale

Phoenix Housing Market Update - March 2016

by James & Amy Lombardi

Long Term Trends

Inventory continued to increase in February which is a typical pattern we see each year. Total active listings are 21,176, that's a 4% decrease in inventory from a year ago. And we are slighlty above our 5 year average of 19,928 homes for sale in February. 

Sales and demand are increasing and will continue that pattern over the next 3-4 months as we are in our peak selling season. Total sales for February was 5,696 which is a 3% decrease from a year ago. And sales volume is below our 5 year average of 6,132 sales for the month of February.

Median sales price for February was $213,00 which is approx 9.2% better than a year ago. This well above the 5 year average of $174,200 and shows us the radical improvement the market has made over the past 5 years. 

Average days on market went up a bit from 79 in January to 82 in February. This is an improvement from a year ago when it was 94. The 5 year average is 85. These trend lines are normal and consistent with trends we see each year.

The average sold to list price for October was 95.8%, which is largely unchanged from the previous month. The 5 year average is 95.3%, so again we are seeing normal trend lines.

Short Term Trends

The most radical short term trend I can see is that New Contracts (pending sales) went up 17.4% from January to February. Total New Contracts written in February was 9,382, this is an increase of 7% from a year ago. This tells us that demand is extremely strong right now and getting stronger! Currently we have approx a 3.5 month supply of inventory on the market. March and April are typically the strongest months for sales volume every year and it appears to be that way again this year.

The market is favoring Sellers right now, however that may change once we get into July and August.

Download February 2016 Housing Report

Interest Rate Watch

A June Rate Hike Could be on the Horizon

Quote

Attributed to Sean Becketti, chief economist, Freddie Mac.

"The Federal Reserve's decision last week to maintain the current level of the Federal funds rate combined with the reduction in their forecast for growth triggered a 3-basis point drop in the 10-year Treasury yield. As a consequence, the 30-year mortgage rate declined 2 basis points to 3.71 percent. However, comments this week by several members of the Fed, including the presidents of the Richmond, San Francisco, and Atlanta banks, indicated that a June rate hike is still on the table."

Prepping Your Home For Sale - Step 1

View MORE videos on Prepping Your Home For Sale

Phoenix Housing Market Update - February 2016

by James & Amy Lombardi

Long Term Trends

Inventory spiked in January which is a typical pattern we see each year. Total active listings are 20,728, that's an 8% decrease in inventory from a year ago. And we are slighlty above our 5 year average of 20,673 homes for sale in January. 

Sales and demand are increasing and will continue that pattern over the next 4 months as we have entered our peak selling season. Total sales for January was 5,094 which is almost a 9% increase from a year ago. That sales volume is below our 5 year average of 5,313 sales for the month of January.

Median sales price for January was $210,00 which is $5000 less than December, but still approx 7.7% better than a year ago. This well above the 5 year average of $172,490 and shows us the radical improvement the market has made over the past 5 years. 

Average days on market went up a bit from 76 in December to 79 in January. This is an improvement from a year ago when it was 95. The 5 year average is 83. These trend lines are normal and consistent with trends we see each year.

The average sold to list price for October was 95.6%, which is largely unchanged from the previous month. The 5 year average is 95.0%, so again you can see we are seeing normal trend lines.

Short Term Trends

In January New Listings were up from December by 77.5% and Pending Sales increased by 42.2%. Closed Sales in January decreased 22.9% from December. This is telling me that inventory and demand is increasing and Decemeber was actually a pretty strong month. Median price decreased, but I'm expecting that to rebound in the coming months. These short term trends typical, but it feels like sellers are losing leverage. I suspect it to tip back into the sellers favor over the next 4-5 months.

The market appears to be moving from a strong Sellers market to a more balanced market. It still favors Sellers, however increasing inventory and weaker demand are starting to work against Sellers.

Download January 2016 Housing Report

Interest Rate Watch

Average US rate on 30-year mortgage falls for 5th straight week

WASHINGTON (AP) —  Average long-term U.S. mortgage rates fell for the fifth straight week amid volatility in world financial markets.

Mortgage buyer Freddie Mac says the average rate on a 30-year fixed-rate mortgage slid to 3.72% this week, down from 3.79% last week and the lowest since it averaged 3.68% in April 2015.

The average rate on a 15-year fixed-rate mortgage slid to 3.01% from 3.07% last week.

Mortgage rates have continued to fall despite the Federal Reserve’s decision in December to raise the short-term rate it controls for the first time since 2006.

Global markets have been rattled this year by signs of a global slowdown  and big drops in the price of commodities, including oil. Investors have sought refuge in U.S. Treasury’s, pushing down long-term U.S. rates.

To calculate average mortgage rates, Freddie Mac surveys lenders across the country at the beginning of each week. The average doesn’t include extra fees, known as points, which most borrowers must pay to get the lowest rates. One point equals 1 percent of the loan amount.

The average fee for a 30-year mortgage was unchanged at 0.6 point. The fee for a 15-year loan was also unchanged at 0.5 point.

The average rate on five-year adjustable-rate mortgages fell to 2.85% this week from 2.90% last week; the fee slid to 0.4 point from 0.5 point last week.

Clipped from USA Today on February 4, 2016, via Associated Press

Is Zillow a Good Website to Use for My Home Search?

View MORE video tips for Buyers and Seller

Phoenix Housing Market Update - November 2015

by James & Amy Lombardi

Long Term Trends

Inventory continued to climb in October with total active listings at 20,027. That's an increase of approx 1700 homes for sale from September. This is a typical trend for this time of year, but is a 14% decrease in inventory from a year ago. And we are below our 5 year average of 20,933 homes for sale in October. 

Sales and demand faded a bit in the past 30 days. Total sales for October were 6,143 which is a 1% increase from a year ago. That sales volume is below our 5 year average of 6,487 sales for the month of October.

Median sales price for October was $212,00 which is unchanged from September and is still approx 9.8% better than a year ago. This well above the 5 year average of $170,270 and shows us the radical improvement the market has made over the past 5 years. 

Average days on market went up a bit from 69 in September to 72 in October. This is an improvement from a year ago when it was 87. The 5 year average is 77. These trend lines are normal and consistent with trends we see each year.

The average sold to list price for October was 96.1%, which is largely unchanged from the previous month. The 5 year average is 96.0%, so again you can see we are seeing normal trend lines.

Short Term Trends

In October New Listings were up from September by 9.4% and Pending Sales declined by 0.1%. Closed Sales in October decreased 9.8% from September. This is telling me that inventory is increasing, and demand is cooling down. Median price was unchanged. These short term trends are a little concerning. Buyers got a little more picky and Sellers have lost a bit of leverage since inventory has increased. 

The market appears to be moving from a strong Sellers market to a more balanced market. It still favors Sellers, however increasing inventory and weaker demand are starting to work against Sellers.

Download November 2015 Housing Report

Interest Rate Watch

Average US rate on 30-year mortgage jumps to 3.98 percent; 15-year loan up to 3.20 percent

WASHINGTON (AP) — Average long-term U.S. mortgage rates this week rose sharply for a second straight week as expectations grew that the Federal Reserve may soon raise its key short-term interest rate.

Mortgage giant Freddie Mac said Thursday the average rate on a 30-year fixed-rate mortgage jumped to 3.98 percent from 3.87 percent a week earlier. Nearing 4 percent, it was the highest level for the 30-year rate since July. The rate on 15-year fixed-rate mortgages climbed to 3.20 percent from 3.09 percent.

A year ago, the average 30-year mortgage rate was 4.01 percent, while the rate for 15-year loans was 3.20 percent.

While it kept the key rate at a record low near zero, the Fed recently signaled the possibility a rate hike could come at its next meeting in December.

An unexpectedly strong employment report for October, released by the government last Friday, amplified expectations of a rate increase. It showed that hiring swelled last month by the largest amount this year — 271,000 jobs — while unemployment dropped another notch to 5 percent.

The market speculation on a Fed increase has brought plunging U.S. government bond prices and soaring yields, which rise as prices fall. The yield on the 10-year Treasury bond, which mortgage rates have been tracking, surged to 2.34 percent Wednesday from 2.22 percent a week earlier. The yield was at 2.32 percent Thursday morning.

To calculate average mortgage rates, Freddie Mac surveys lenders across the country at the beginning of each week. The average doesn't include extra fees, known as points, which most borrowers must pay to get the lowest rates. One point equals 1 percent of the loan amount.

The average fee for a 30-year mortgage was unchanged at 0.6 point last week. The fee for a 15-year loan also remained at 0.6 point.

The average rate on five-year adjustable-rate mortgages jumped to 3.03 percent from 2.96 percent; the fee held at 0.4 point. The average rate on one-year ARMs rose to 2.65 percent from 2.62 percent; the fee was steady at 0.2 point.

Clipped from US News on November 12, 2015, via Associated Press

Why Should You Hire Us?

Why should I hire you to sell my home? Here are 3 reasons: 1. Our 1 day listing agreement allows you to fire us at any time 2. We rank in the top 1% of agents for our market 3. Our 48 point marketing strategy has a proven track record of success.

View MORE video tips for Buyers and Seller

Phoenix Housing Market Update - October 2015

by James & Amy Lombardi

Long Term Trends

Inventory jumped up in September with total active listings at 18,380. That's an increase of more than 1000 homes for sale from August. This is a typical trend for this time of year, but is a 15% decrease in inventory from a year ago. And we are below our 5 year average of 19,411 homes for sale in August. No real concerns with this activity, it is normal.

Sales are extremely strong as demand has improved dramtically this year. Total sales for September were 6,809 which is a 11% increase from a year ago. The sales volume is slightly better than our 5 year average of 6,672 sales for the month of September.

Median sales price improved 1.4% from August and has increased 9.8% from a year ago and was $212,000 for September. This well above the 5 year average of $170,450 and shows us the radical improvement the market has made over the past 5 years. Again this is an illustration of how strong demand is right now.

Average days on market went from 74 in August to 69 for September. This is also an improvement from a year ago when it was 83. The 5 year average is 74. This is another illustration of how demand continues to be strong.

The average sold to list price for September was 96.4%, which is largely unchanged from the previous month. The 5 year average is 96.1%, so again you can see how stronger demand means homes are selling closer to list price.

Short Term Trends

In September New Listings were up from August by 8% and Pending Sales declined by 6.8%. Closed Sales in September decreased 1.1% from August. This is telling me that inventory is increasing, which is typical for this time of year, and demand is cooling down, which is also typical for this time of year. The good news is that median price increased by 1.4% which tells me that although there may not be as many buyers in the market they are still strong enough to push values up.

The market will probably remain fairly flat until the end of the year and then pickup again in late January. I'm not expecting a whole lot of movement in the short term on property values and inventory.

Download September 2015 Housing Report

Interest Rates

Average US rate on 30-year mortgage rises to 3.82 percent; 15-year loan up to 3.03 percent

WASHINGTON (AP) — Average long-term U.S. mortgage rates rose this week yet remained below 4 percent for a 12th straight week.

Mortgage giant Freddie Mac said Thursday the average rate on a 30-year fixed-rate mortgage increased to 3.82 percent from 3.76 percent a week earlier. The rate on 15-year fixed-rate mortgages rose to 3.03 percent from 2.99 percent.

Despite the increase, rates remained well below last year's levels, providing an inducement for potential homebuyers.

A year ago, the average 30-year mortgage rate was 3.97 percent, while the rate for 15-year loans was 3.18 percent.

In recent days, two influential members of the Federal Reserve's policymaking body spoke in favor of postponing an increase in its key short-term interest rate. The Fed has been expected to raise the benchmark rate later this year for the first time in nine years.

To calculate average mortgage rates, Freddie Mac surveys lenders across the country at the beginning of each week. The average doesn't include extra fees, known as points, which most borrowers must pay to get the lowest rates. One point equals 1 percent of the loan amount.

The average fee for a 30-year mortgage held steady from last week at 0.6 point. The fee for a 15-year loan also remained at 0.6 point.

The average rate on five-year adjustable-rate mortgages was unchanged at 2.88 percent; the fee remained at 0.4 point. The average rate on one-year ARMs declined to 2.54 percent from 2.55 percent; the fee was steady at 0.2 point.

Clipped from US News on Ocotober 15, 2015, via Associated Press

Why Do You Sell Real Estate?

Over the years we’ve learned that understanding why you do anything in life gives you a sense of purpose and clarity which greatly improves your performance and happiness. The truth is 95% of licensed agents out there just aren’t very active or experienced in today’s market. And on a daily basis we come across people that have chosen to work w/ this type of agent and their experience has been stressful and frustrating. We feel it is our duty to protect you against this type of agent.

View MORE video tips for Buyers and Seller

Phoenix Housing Market Update - September 2015

by James & Amy Lombardi

Phoenix Market Report September 2015

Long Term Trends

Inventory continues to shrink with the total active listings for August reporting at 17,320. This is nearly a 20% decrease in inventory from a year ago. And we are below our 5 year average of 18,515 homes for sale in August.

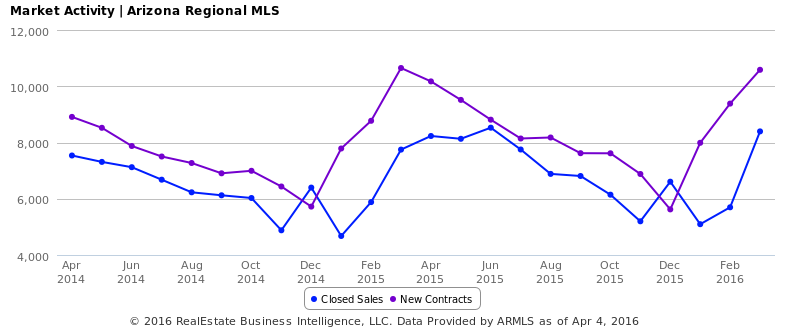
Sales are extremely strong as demand has improved dramtically this year. Total sales for Auguest were 6,885 which is a 10% increase from a year ago. While sales are strong they are still slightly below our 5 year average of 7,211 sales for the month of August.

Median sales price has increased 6.6% from a year ago and was $209,000 for August. This well above the 5 year average of $168,200 and shows us the radical improvement the market has made over the past 5 years.

Average days on market for August was 74. This is an improvement from a year ago when it was 86. The 5 year average is 77. This is another illustration of how much demand has improved this year.

The average sold to list price for August was 96.2%, which is up from last when it reported at 94.7%. The 5 year average is also 96.2%, so again you can see how stronger demand means homes are selling closer to list price.

Short Term Trends

In August New Listings were down from July by 5.1% and Pending Sales slightly improved by 0.4%. Closed Sales in August were 11.2% from July. This data is showing we are entering our typical seasonal slowdown as school started in August. The peak selling season generally runs from February to July, so its not surprising to see Closed Sales drop off in August, this is typical. The Median Price also dropped by 1.3% from July to August. Again, no alarms here, but something to watch. The market will probably remain fairly flat until the end of the year and then pickup again in late January. I'm not expecting a whole lot of movement in the short term on property values and inventory.

Something to watch is the impact of the recent volatility in the Stock Market and how that will affect interest rates. A slight increase in interest rates can spark a short term increase in sales as buyers jump off the fence to purchase before rates continue to rise. However if rates do continue to rise then it will have a negative impact on home values as the cost of borrowing goes up.

Download September 2015 Housing Report

Interest Rates

Interest Rate Hike 2015: 3 Things Consumers Should Do Before The Federal Reserve's Inevitable Liftoff

Clipped from the International Business Times September 9, 2015

It’s been relatively inexpensive for consumers to borrow money and pay interest on loans for the last decade. But that's about to change, possibly as soon as this month.

The U.S. Federal Reserve has kept interest rates hovering at historic, near-zero lows for nearly seven years and hasn't raised rates since 2006. With interest rate changes quickly approaching, experts are advising consumers not to panic. “This Fed rate increase will probably be a marathon, not a sprint,” said Matt Schulz, senior industry analyst at CreditCards.com.

The Fed's rate increases will be slow and gradual. The first hike, likely a quarter of a percentage point, will get a lot of attention, but it's unlikely to have a significant impact on your household budget.

“Consumers won’t even notice,” said Greg McBride, chief financial analyst at Bankrate.com. However, what will have a greater effect on consumers' wallets and purses is the culmination of a series of rate hikes over 12 to 18 months. The best course of action? In general, consumers should take steps now to reduce debt. Then households will begin to notice. The cumulative moves will have a significant effect on adjustable-rate mortgages, credit card rates and home equity lines of credit, McBride said.

The Fed's inevitable interest rate hike will affect average consumers in three key areas: mortgages, credit cards and bank loans. The central bank's action could begin as soon as next Wednesday. Here's what you can do as the window of opportunity narrows:

1. Refinance The Mortgage 

Consumers with adjustable-rate mortgages (ARMs) should take action now, or have a game plan to pay down the loan before big payment increases start coming their way. The best bet is to refinance into a fixed-rate mortgage, McBride advised, which are still hovering around 4 percent.

“Those are opportunities that exist now, but may not persist once the Fed starts raising interest rates,” McBride said.

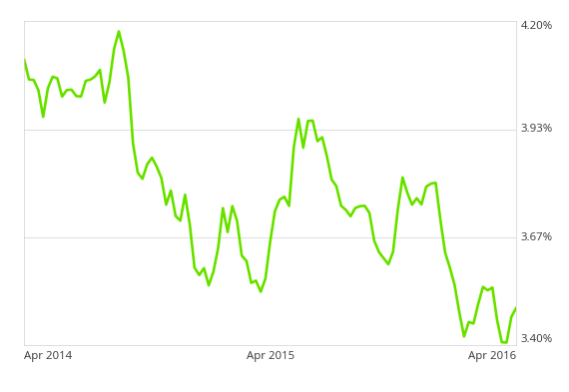
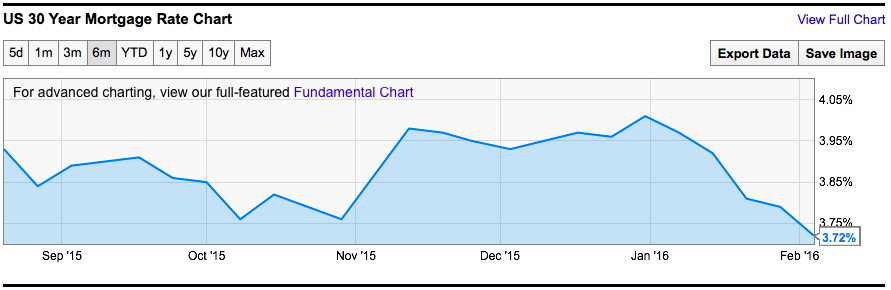
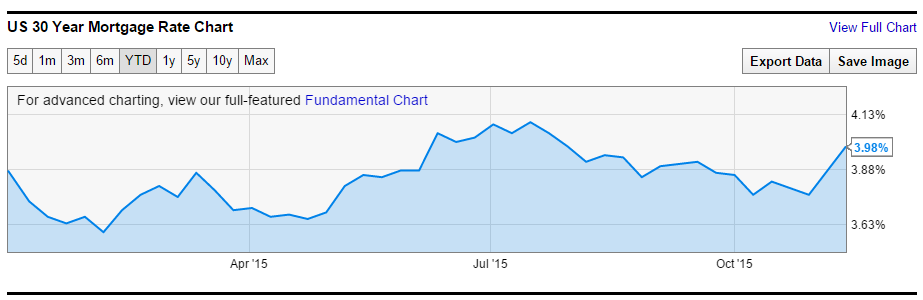
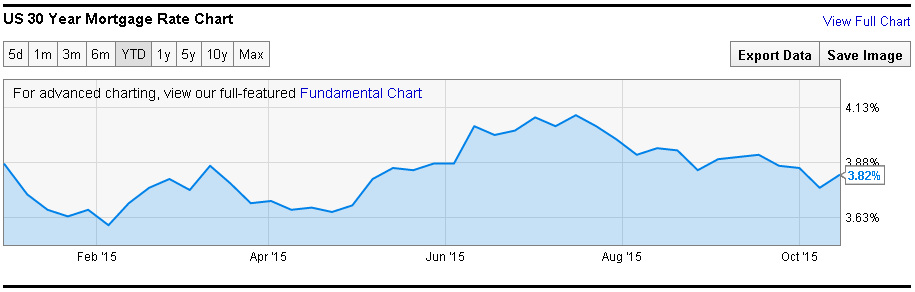
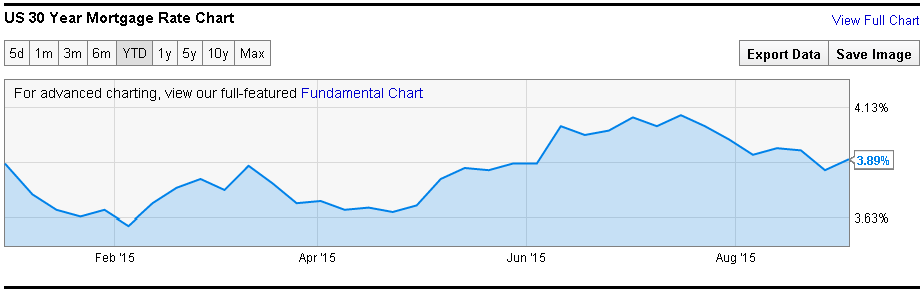
The average rate on a 30-year fixed-rate mortgage has been at record lows since the Federal Reserve took steps to revive the U.S. economy following the 2007-09 financial crisis. As the central bank prepares to move away from crisis-level rates, lenders will quickly begin to set mortgage rates based on their expectations for future inflation and interest rates. The benchmark 30-year fixed-rate mortgage edged up to 4.05 percent from 4.03 percent, according to Bankrate's Sept. 2 survey of large lenders. That’s down from 4.1 percent four weeks ago and 4.24 percent a year ago.

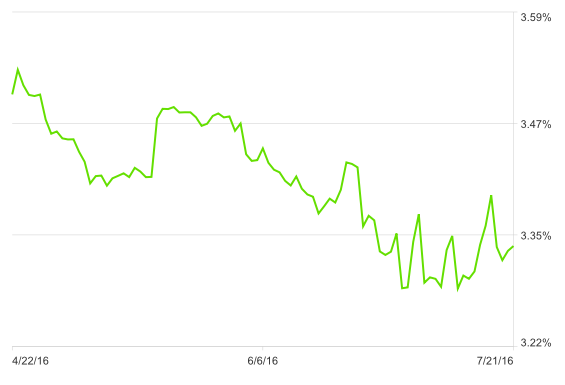
Consumers also could refinance into one of the other hybrid ARMs to buy another five to seven years of fixed rates, which currently hover in the low 3 percent range. The rate on the benchmark 5/1 ARM (a fixed rate for the first five years and then adjustments thereafter) rose to 3.23 percent from 3.16 percent Sept. 2.

2. Chip Away At Debt

Now is also an opportunity to chip away at variable-rate debt before interest rates begin to climb, including credit cards, student loans, auto loans and home equity lines of credit. Here’s the breakdown of what a Fed hike would cost consumers:

Let’s assume a 15 percent annual percentage rate (APR), which is the current average for new credit card offers: On a $5,000 balance, with a 15 percent APR and a $150 per month payment, interest would total $1,508.52 and it would take 44 months to pay off the balance.

If the balance and the payment remain equal, but the interest rate is increased by 0.25 percent, which is in theory what would happen if the Fed raises rates by 0.25 percent, $36 would be added to the interest total. For example, if the Fed raised rates a quarter-point, a $5,000 balance with a 15.25 percent APR and a $150 per month payment equals $1,544.74 in interest over 44 months.

Although it’s not a huge amount, where it starts to add up is if the Fed continues to raise rates over the course of the next two years. For instance, if the Fed raises rates a full percentage point over time a $5,000 balance with a 16 percent APR and $150 per month payment equals $1,656.82 in interest over 45 months.

If the APR increases from 15 percent to 16 percent, roughly $150 in extra interest is added to the balance versus the initial $36 increase.

Meanwhile, on a $25,000 loan, the effects would be minimal at first because a quarter of a percentage point translates to only a few dollars a month more. “A quarter of a percent move is pretty inconsequential,” McBride said. But over the course of 18 months or two years, in a more notable fashion, that’s when it starts to make a dent in the household budget, McBride warned.

Borrowers who took out home equity lines of credit during the housing boom should be especially mindful of when the 10-year draw period comes to an end. A draw period allows a holder of a line of credit to withdraw money for a period of 10 years. Once the draw period is over, the borrower can no longer tap into the line of credit.

Once the 10-year period is up, borrowers are no longer paying just the interest on the loan. The monthly payments increase to cover interest expense and the principal balance over the remaining term of the loan.

That produces a significant payment increase completely independent of interest rates, McBride said.

3. Snag Zero-Percent Credit Card Offers

Consumers should also try to snag zero-percent introductory rates and balance-transfer offers on credit cards -- and do it now. As the Fed moves away from zero-percent interest rates, credit card issuers act accordingly and raise their interest rates. They also will be less likely to offer zero-percent rates.
“There’s a decent chance that zero-percent offering might become a bit of an endangered species soon,” Schulz said.

Those thinking of doing a balance transfer should take action as soon as possible. If banks won’t be borrowing for free anymore, they might not let their cardholders do it either.

But if the zero percent offers stick around, banks may end up going a different route and raise fees associated with those zero-percent offers. Instead of having a 3 percent balance transfer fee associated with a card, it might be 4 percent or 5 percent. “That’s significant as well,” Schulz said.

James & Amy Lombardi Background

Ranked in the Top 1% of Agents for sales production 2012, 2013, 2014, 2015. Featured in Phoenix Magazine as one of the Best of Realtors in our market for 2015. Full time licensed agent since 2004, has sold over 700 homes and sells approx 50 homes per year. Top producing Husband & Wife real estate team.

View video tips for Buyers and Seller

Displaying blog entries 41-50 of 51

Syndication

Categories

Archives

RE/MAX Professionals Each office independently owned and operated

**Top 1% of Agents is measured by annual sales volume and/or total transactions**